Behind the scenes
next-yak: Innovation made in Zurich (part 2)
by Christian Margadant

Page load times are important. We want you to navigate our shopping universe at the speed of light. Rage clicks and nervous breakdowns because pages take forever to load? Not on digitec and Galaxus. We’re working hard to become one of Europe’s fastest online shops.
Humans are complex beings and, as the product of their genome, are the same as they were 10,000 years ago. But our environment is not. We live in a digital world; not one that requires hunting mammoths. Page speed is important for two reasons:
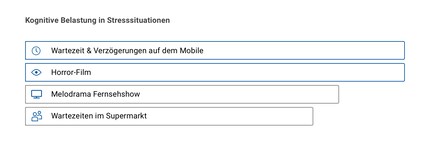
Here’s a fun fact: According to a neuroscience study, delays in web page load times and video streaming can be as stressful as watching a horror movie. You’ll find good horror movies here, but not as a result of using our online shop.

What happened so far: It's mobile, stupid!
So have we put the arrows aside and stopped chasing hairy mammoths at Digitec Galaxus? Not quite. There's definitely a lot to do when it comes to page speed. In recent years, this topic has become more and more important from a technical perspective. Two developments in particular have contributed greatly to this:
According to Google's RAIL model, the load time of a website represents one of four relevant aspects for the evaluation and conception of the perceived performance experience of a website. The other three aspects are response, animation and idle, which all together aim to reflect the experience for you as a customer.
The isomorphic front-end stack boosts speed
It's important to understand that load time doesn't just represent a single moment but a comprehensive experience in the visual and interactive design of a website. Therefore, it takes more than one metric to measure it. We've decided to use Google's concept to optimally measure our loading time, and in the "Load" section of the rail model, we're guided by the "User Centric Performance Metrics". The User Centric Performance Metrics describe the customer's success as milestone-based timing metrics, i.e. in seconds.
In order to define metrics, it’s important to know the underlying customer needs so that these can be measured. When loading a website, a customer is looking for quick feedback on three milestones, If this is given, the customer has a positive experience with the according website.
| Milestone | Customer need |
|---|---|
| 1 | Did anything happen after I entered something? Did the navigation start successfully? Has the server responded? |
| 2 | Is the first thing I see useful? Do I see the most important elements of a page first? |
| 3 | Are the displayed visual elements useful? Can I interact with them? |
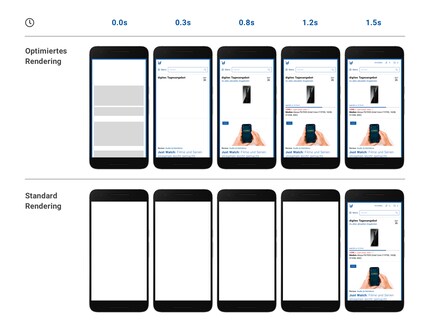
By introducing an isomorphic front-end stack to our front-end, the page is no longer rendered on the server all at once, but progressively on the client. This gives us the possibility to assign an individual value to each pixel on the website. It's easy to understand that we want to display visual elements in the Viewport with priority and speed.

To measure customer needs and to understand when a website delivers visual feedback in the form of rendered elements, we’re extending our table with the following three metrics and their meaning:
| Milestone | Metric | Meaning | |
|---|---|---|---|
| 1 | Is it happening? | First Contentful Paint | First Contentful Paint marks the points when the user sees text or images for teh first time. |
| 2 | Is it useful? | First Meaningful Paint | First Meaningful Paint (FMP) marks the point in time when the most important elements of the page are visible to the user. |
| 3 | Is it usable? | Time to Interactive & First Input Delay | Time to Interactive (TTI) marks the point at which your application is both visually rendered and capable of reliably responding to user input.
First Input Delay (FID) measures the delay a customer experiences during a first interaction when the page (or certain parts of it) is not yet interactive. |
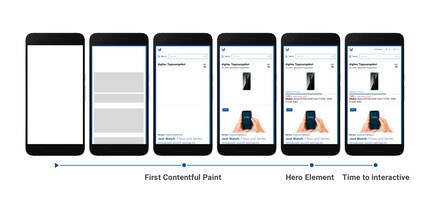
These metrics can be visualised in a timeline of loading a web page:

Measurements: the magic is in the mix
These metrics can be measured based on two data sources: real customer data and so-called synthetic monitoring.
Real User Monitoring (RUM) captures and analyses transaction by real users of a website or application. In other words, transactions by everyone, no matter if you’re next to a 5G antenna or browsing our online shop in the tunnel in the mountains. For us, this is the naked truth and represents exactly what you’re experiencing.
Synthetic monitoring gathers data by simulating the path an end user takes through a website. Well-known tools for this are Lighthouse by Google or WebPageTest.org. A range of settings can be used to measure the load performance of web pages based on criteria such as device or network speed.
We've agreed on clear budgets to allow putting the performance measurements into perspective. This allows us to determine for each page whether the load times meet our requirements for excellent user experience. Our budgets are absolute figures, which we want to achieve for the 95th percentile. Percentile to achieve. In other words, we expect 95% of all page views to be faster than this budget defines. As a result, our table is extended as follows:
| Milestone | Metric | Budget (95 Percentil) | Measurement | |
|---|---|---|---|---|
| 1 | Is it happening? | First Contentful Paint | <1 Sek | RUM |
| 2 | Is it useful? | First Meaningful Paint | <3 Sek | RUM |
| 3 | Is it usable? | Time to Interactive | <5 Sek | Synthetic |
| 3 | Is it usable? | First Input Delay | <100ms | RUM |
These budgets are industry standards and are today used as a benchmark to evaluate page performance. Interestingly, some of the budgets are still based on the work of
Robert B. Miller "Response Time in Man-Computer Conversational Transactions from 1968. However, our customers expect page speeds to increase and these benchmarks to be improved continuously. As I mentioned earlier, page performance isn't a single moment in the loading process of a website. This needs to be taken into account when interpreting the measured values and budgets. It's the combination of all metrics that shapes the user experience.
Investing in the future
Besides the obvious advantages of a faster website for customers, page speed is also an important part of any visibility, i.e. our website's scoring with search engines such as Google. Since the launch of the "Let's make the web faster" initiative in 2009, Google has been investing in a fast and user-friendly web and favours websites with fast loading times in its rankings. Performance is one important ranking factor among many.
This subject is gaining momentum and we're experimenting with code adjustments to boost page speed even more. We'll keep you up to date.
Obsessed with solving digital problems. Outcomes over output. Don't blindly follow every technology trend. Never fake product success with random KPIs. Never give up because an idea fails. Life is an experiment. Amen.
News about features in our shop, information from marketing and logistics, and much more.
Show all