Behind the scenes
Not for you? The most frequently returned products of 2025
by Daniel Borchers

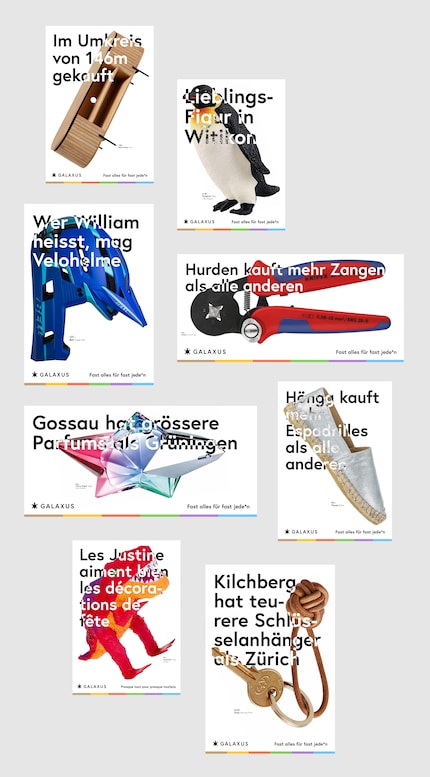
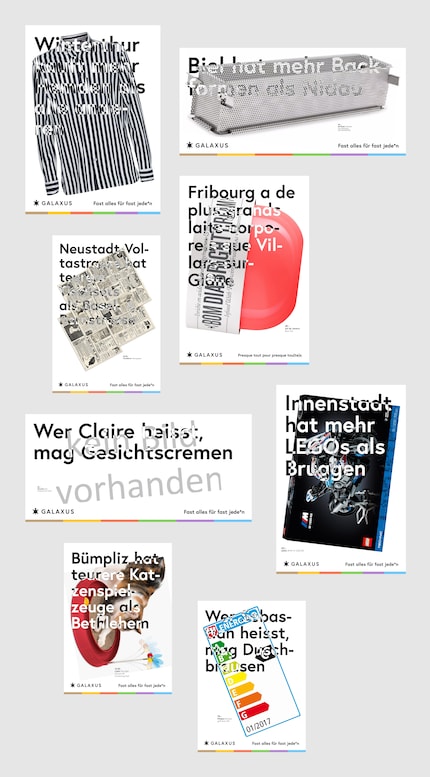
Do people in Kilchberg have more expensive key chains than people in Zurich? Who buys abdominal trainers anyway? What’s likely to be your first name if you’re a fan of cake pans? Using 10,226 images, the latest Galaxus ad campaign reveals the surprising answers to these questions.
After a two-year break and new orders flooding in from all over Switzerland, our computer-generated ad campaign on regional shopping habits is back with a vengeance. This time, we allowed the algorithm we programmed to go a step further and create designs too.
Our interactive map displays the results generated for your neck of the woods.
As with our 2020 campaign, we used anonymised order data as the basis for the automatically generated images. Over several days of computing, the algorithm created surprising insights based on your shopping data and worked them up into 10,226 motifs. Since we didn’t retroactively optimise or correct the images for either campaign, some results are, let’s say, less convincing than others.


We’ve changed a couple of other things too. A new local price comparison reveals which municipalities spend more on safety goggles, headphones or water bottles than their neighbours. In addition, thanks to data on the surrounding area, customers won’t just find the items they’ve ordered in parcels – they’ll see them on billboards or posters in their neighbourhood too. All anonymous, of course.
The fact that all 10,226 motifs have been hung up in the right place is again thanks to the extraordinary efforts of the printing and poster companies. Hats off to them!
News about features in our shop, information from marketing and logistics, and much more.
Show all
Behind the scenes
by Daniel Borchers

Behind the scenes
by Tobias Heller

Behind the scenes
by Julia Dürr